
How stats are calculated
This page explains the rules behind every number on the dashboard and in Analytics. If a total ever looks off, the answer is usually one of the rules below.
Two kinds of numbers
Section titled “Two kinds of numbers”MoneyMatter shows two different kinds of numbers, and they follow different rules.
- Income and expense numbers answer “how much came in or went out during this period?” They add up your transactions. The Expenses Structure, Cash Flow and Categories Watchlist widgets work this way, and so do the Trends Comparison, Cash Flow and Pivot reports.
- Balance numbers answer “how much did I have on this day?” They read your account balances, not individual transactions. The Balance trend and Net Worth widgets and the Net Worth History report work this way.
This is why a number can move in one place and not the other. A transfer or a balance correction changes a balance without being income or an expense. Exchange rates can change the value of a foreign-currency balance on a day with no transactions at all.
At a glance
Section titled “At a glance”| Income and expense numbers | Balance numbers | |
|---|---|---|
| Expense and Income transactions | Counted | Change the balance |
| Transfers between your own accounts | Not counted, except loan payments (an expense) | One account goes down, the other goes up |
| Out of Wallet transfers | Not counted | Change the balance |
| Balance adjustments | Not counted | Change the balance |
| Linked refunds | Subtracted from the original purchase, not counted as new income | Change the balance |
| Split transactions | Each part counts under its own category | The whole amount changes the balance |
| Accounts with Exclude from statistics on | Left out | Left out |
| Archived accounts | Counted, unless also excluded | Counted, unless also excluded |
| Savings categories | Left out of cash-flow numbers only | No effect |
| Include credit limits in balance setting | No effect | Credit limits subtracted when on |
The sections below explain each row.
What counts as income and expenses
Section titled “What counts as income and expenses”A transaction’s type decides where it goes: an Expense counts as spending and an Income counts as income. The exceptions are linked refunds, savings categories and accounts excluded from statistics, all explained below.
Transfers between your own accounts
Section titled “Transfers between your own accounts”A Transfer between two of your accounts is never income or an expense. The money only moved from one of your pockets to another, so counting it would inflate both sides.
The one exception is a loan payment. Money you transfer into a loan counts as an expense, because paying off debt is money leaving your pocket.
For example, you move 500 EUR from your current account to your savings account. Your expenses stay the same, your income stays the same, and your net worth doesn’t change. One balance goes down by 500 and the other goes up by 500.
For more on how transfers are recorded, see How transfers work.
Out of Wallet transfers
Section titled “Out of Wallet transfers”An Out of Wallet transfer moves money to or from somewhere you don’t track in MoneyMatter. It is also left out of income and expenses. It still changes the account’s balance, so your balance and net worth go down (or up) while your expenses don’t.
Balance adjustments
Section titled “Balance adjustments”When you correct an account’s balance with Adjust balance (see Adjust a balance), the dialog says something like “An income of 50 EUR will be created”. The correction does change the balance, but it never counts as income or an expense in stats. It’s there to fix the balance, not to change how much you spent or earned.
Refunds
Section titled “Refunds”When you link a refund to the original transaction, the refund lowers the original purchase instead of counting as new income.
- It nets against the original’s category. A 30 EUR refund of a 100 EUR clothing purchase leaves 70 EUR of clothing spending. If the refund is linked to one part of a split transaction, it nets against that part’s category.
- It works in both directions. An expense linked as a refund of an income lowers your income instead of counting as spending.
- Several partial refunds of the same purchase each reduce it.
- A refund that isn’t linked to anything is ordinary income.
When the refund arrives in a later period
Section titled “When the refund arrives in a later period”Reports place a refund in time in one of two ways.
In cash-flow reports, the refund is subtracted in the period the money came back. This applies to the Cash Flow widget, the Cash Flow report, and the Monthly Comparison chart, summary cards and Cumulative Progress in Trends Comparison. A report does this only when the original purchase is also inside the dates it’s looking at. If the purchase is outside those dates, the refund shows as ordinary income.
The Cash Flow widget, with a whole month selected, also looks at the five months before it. So there, a refund of a purchase from those months still lowers this month’s expenses.
Here’s an example. You spend 100 EUR on January 10, and a 30 EUR refund linked to it arrives on February 5.
| Viewing in the Cash Flow report | January | February | Total |
|---|---|---|---|
| January to February | Expenses 100 | Expenses −30, income 0 | Expenses 70 |
| February only | Income 30 (the purchase is outside the range) | Income 30 |
In spending-by-category views, the refund is subtracted from the original purchase’s category in the purchase’s own period, whenever the refund arrives. This applies to the Expenses Structure widget, the Category Breakdown in Trends Comparison and the flow diagram in the Cash Flow report. In the example above, January shows 70 EUR for that category, and February shows nothing for it. A category never goes below zero.
Pivot subtracts refunds only when Measure is Expenses, in the column where the money came back.
Split transactions
Section titled “Split transactions”When you split a transaction, each part counts under its own category. The main category gets what’s left after the split parts.
For example, a 120 EUR purchase in Groceries with a 40 EUR part split to Household counts as 80 EUR of Groceries and 40 EUR of Household.
If you hide a category from a widget with Exclude categories, only the parts in that category are removed. A split part in a visible category keeps counting, even when the transaction’s main category is hidden.
Categories and subcategories
Section titled “Categories and subcategories”- The Expenses Structure widget groups subcategories under their top-level category.
- Hiding a parent category from a widget with Exclude categories hides all of its subcategories too, including ones you create later.
- Hiding only a subcategory keeps the parent counting, minus that subcategory.
For how categories are organised, see Categories.
Accounts left out of stats
Section titled “Accounts left out of stats”Exclude from statistics
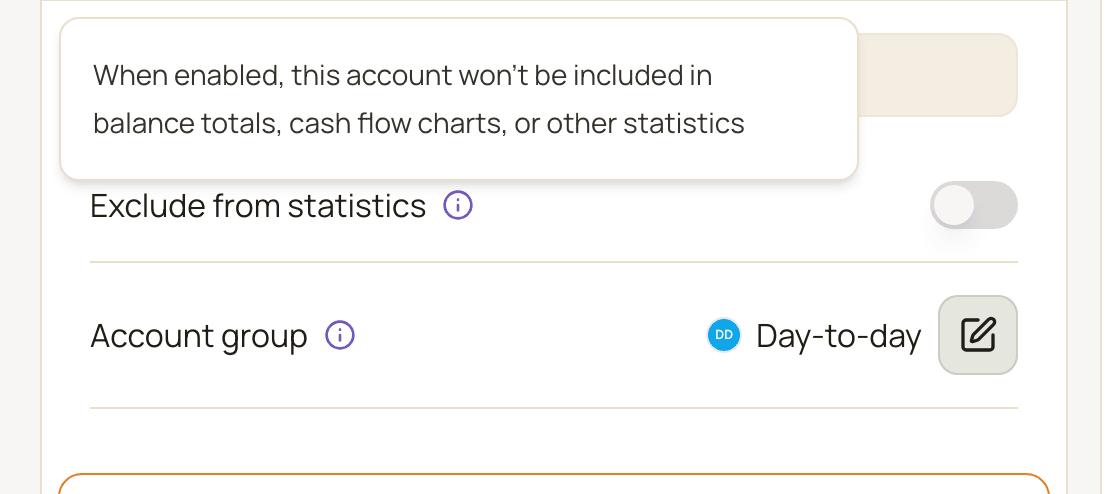
Section titled “Exclude from statistics”Turn this on for an account you don’t want in any numbers, for example an account you track for someone else. The account is then left out of every stat: income and expenses, balances and net worth.
To change it, open the account, go to the Settings tab and switch Exclude from statistics on or off. See Exclude an account from statistics for details.
Archived accounts
Section titled “Archived accounts”Archiving an account doesn’t remove it from stats by itself. Its past transactions and balance keep counting.
When you archive an account, the confirmation dialog has an Also exclude from statistics checkbox. It’s ticked by default, so most archived accounts end up excluded.
See Manage accounts for more on archiving.
Savings categories
Section titled “Savings categories”In General settings, Count categories as savings lets you pick categories that mean “money I set aside” rather than “money I spent”. Money in these categories and their subcategories is left out of both income and expenses, so it counts as savings instead.
This applies to cash-flow numbers only: the Cash Flow widget, the Cash Flow report (where its flow diagram shows that money as a savings destination) and the Monthly Comparison chart in Trends Comparison. The spending breakdowns (the Expenses Structure and Categories Watchlist widgets, Trends Comparison’s summary and Category Breakdown, and Pivot) still show that money as spending.
For example, you earn 3,000 EUR and spend 2,000 EUR, and 500 EUR of that goes to a savings category.
| Expenses | Net savings | Savings rate | |
|---|---|---|---|
| Without a savings category | 2,000 | 1,000 | 33% |
| With a savings category | 1,500 | 1,500 | 50% |
Currencies
Section titled “Currencies”All stats are shown in your base currency.
- Each transaction is converted when you save it, using the exchange rate for the transaction’s date. Reports use that converted amount, so a past expense doesn’t change when rates move later.
- If a currency has a custom rate (its Live update switch is off), that rate is used for every date.
- If no rate exists for the exact day, the most recent rate MoneyMatter has is used instead.
- Editing a transaction converts it again, at the rate for its current date.
- Changing a custom rate re-values the balances of accounts in that currency, but not the transactions you already recorded.
- Changing your base currency recalculates every transaction at the exchange rate for its own date.
Why net worth moves with exchange rates
Section titled “Why net worth moves with exchange rates”For an account you manage manually in another currency, the balance charts value what you hold each day at that day’s exchange rate. So your balance and net worth can rise or fall on a day with no transactions, while your income and expenses stay the same.
For example, you hold 1,000 USD and your base currency is EUR. If the dollar strengthens, your net worth goes up that day, but no income is recorded.
Balances and net worth
Section titled “Balances and net worth”- The Balance trend and Net Worth widgets add up your own accounts, plus portfolios and other assets you track, minus loans. Accounts with Exclude from statistics on are left out. Archived accounts are included.
- Net Worth History splits the same money into Assets (Cash & accounts, Investments, Vehicles, Ventures) and Liabilities (Credit card, Loan, Overdraft). Net worth is assets minus liabilities.
- A credit card or overdraft account with a positive balance counts as cash, not debt.
- An ordinary account that’s overdrawn counts as an Overdraft liability.
Include credit limits in balance
Section titled “Include credit limits in balance”This setting is in General settings and is off by default. Turn it on if your card’s balance in MoneyMatter shows the available credit rather than what you owe. When it’s on, each account’s credit limit is subtracted from its balance in the Balance trend and Net Worth widgets and in Net Worth History.
For example, a card with a 1,000 EUR limit where you’ve spent 200 EUR shows a balance of 800 EUR. With the setting on, it counts as −200 EUR, which is what you owe. With it off, it counts as 800 EUR.
In the charts, the setting only affects accounts with a credit limit above zero that aren’t excluded from statistics. It also changes the balance shown next to each account in the sidebar and in your account lists, for every account with a credit limit. It never changes income or expenses.
Periods
Section titled “Periods”- Both the first and the last day of a period are included in full.
- Weeks start on Monday in every report. Bi-weekly means two-week blocks.
Planned transactions
Section titled “Planned transactions”A planned transaction is one you’ve added ahead of time, for a payment or income that hasn’t happened yet. You create one by turning on Planned when you add a transaction, and it’s listed under Upcoming on the Transactions page.
Planned transactions haven’t happened yet, so they never change a balance. Reports treat them differently:
- Dashboard widgets that show income and expenses count them by default. Each widget has an Include planned transactions switch in its settings.
- The Balance trend widget shows them as a dashed projection past today. It does this when the period reaches today and the line is set to Total or Accounts. The projection is on by default; switch off Include planned transactions in the widget’s settings to hide it.
- The Cash Flow report and the Monthly Comparison and Category Breakdown charts in Trends Comparison always count them.
- The Trends Comparison summary and Cumulative Progress, Pivot and Net Worth Drivers never count them.
That’s why two numbers on the same page can differ when you have planned transactions in the period.