
Dashboard
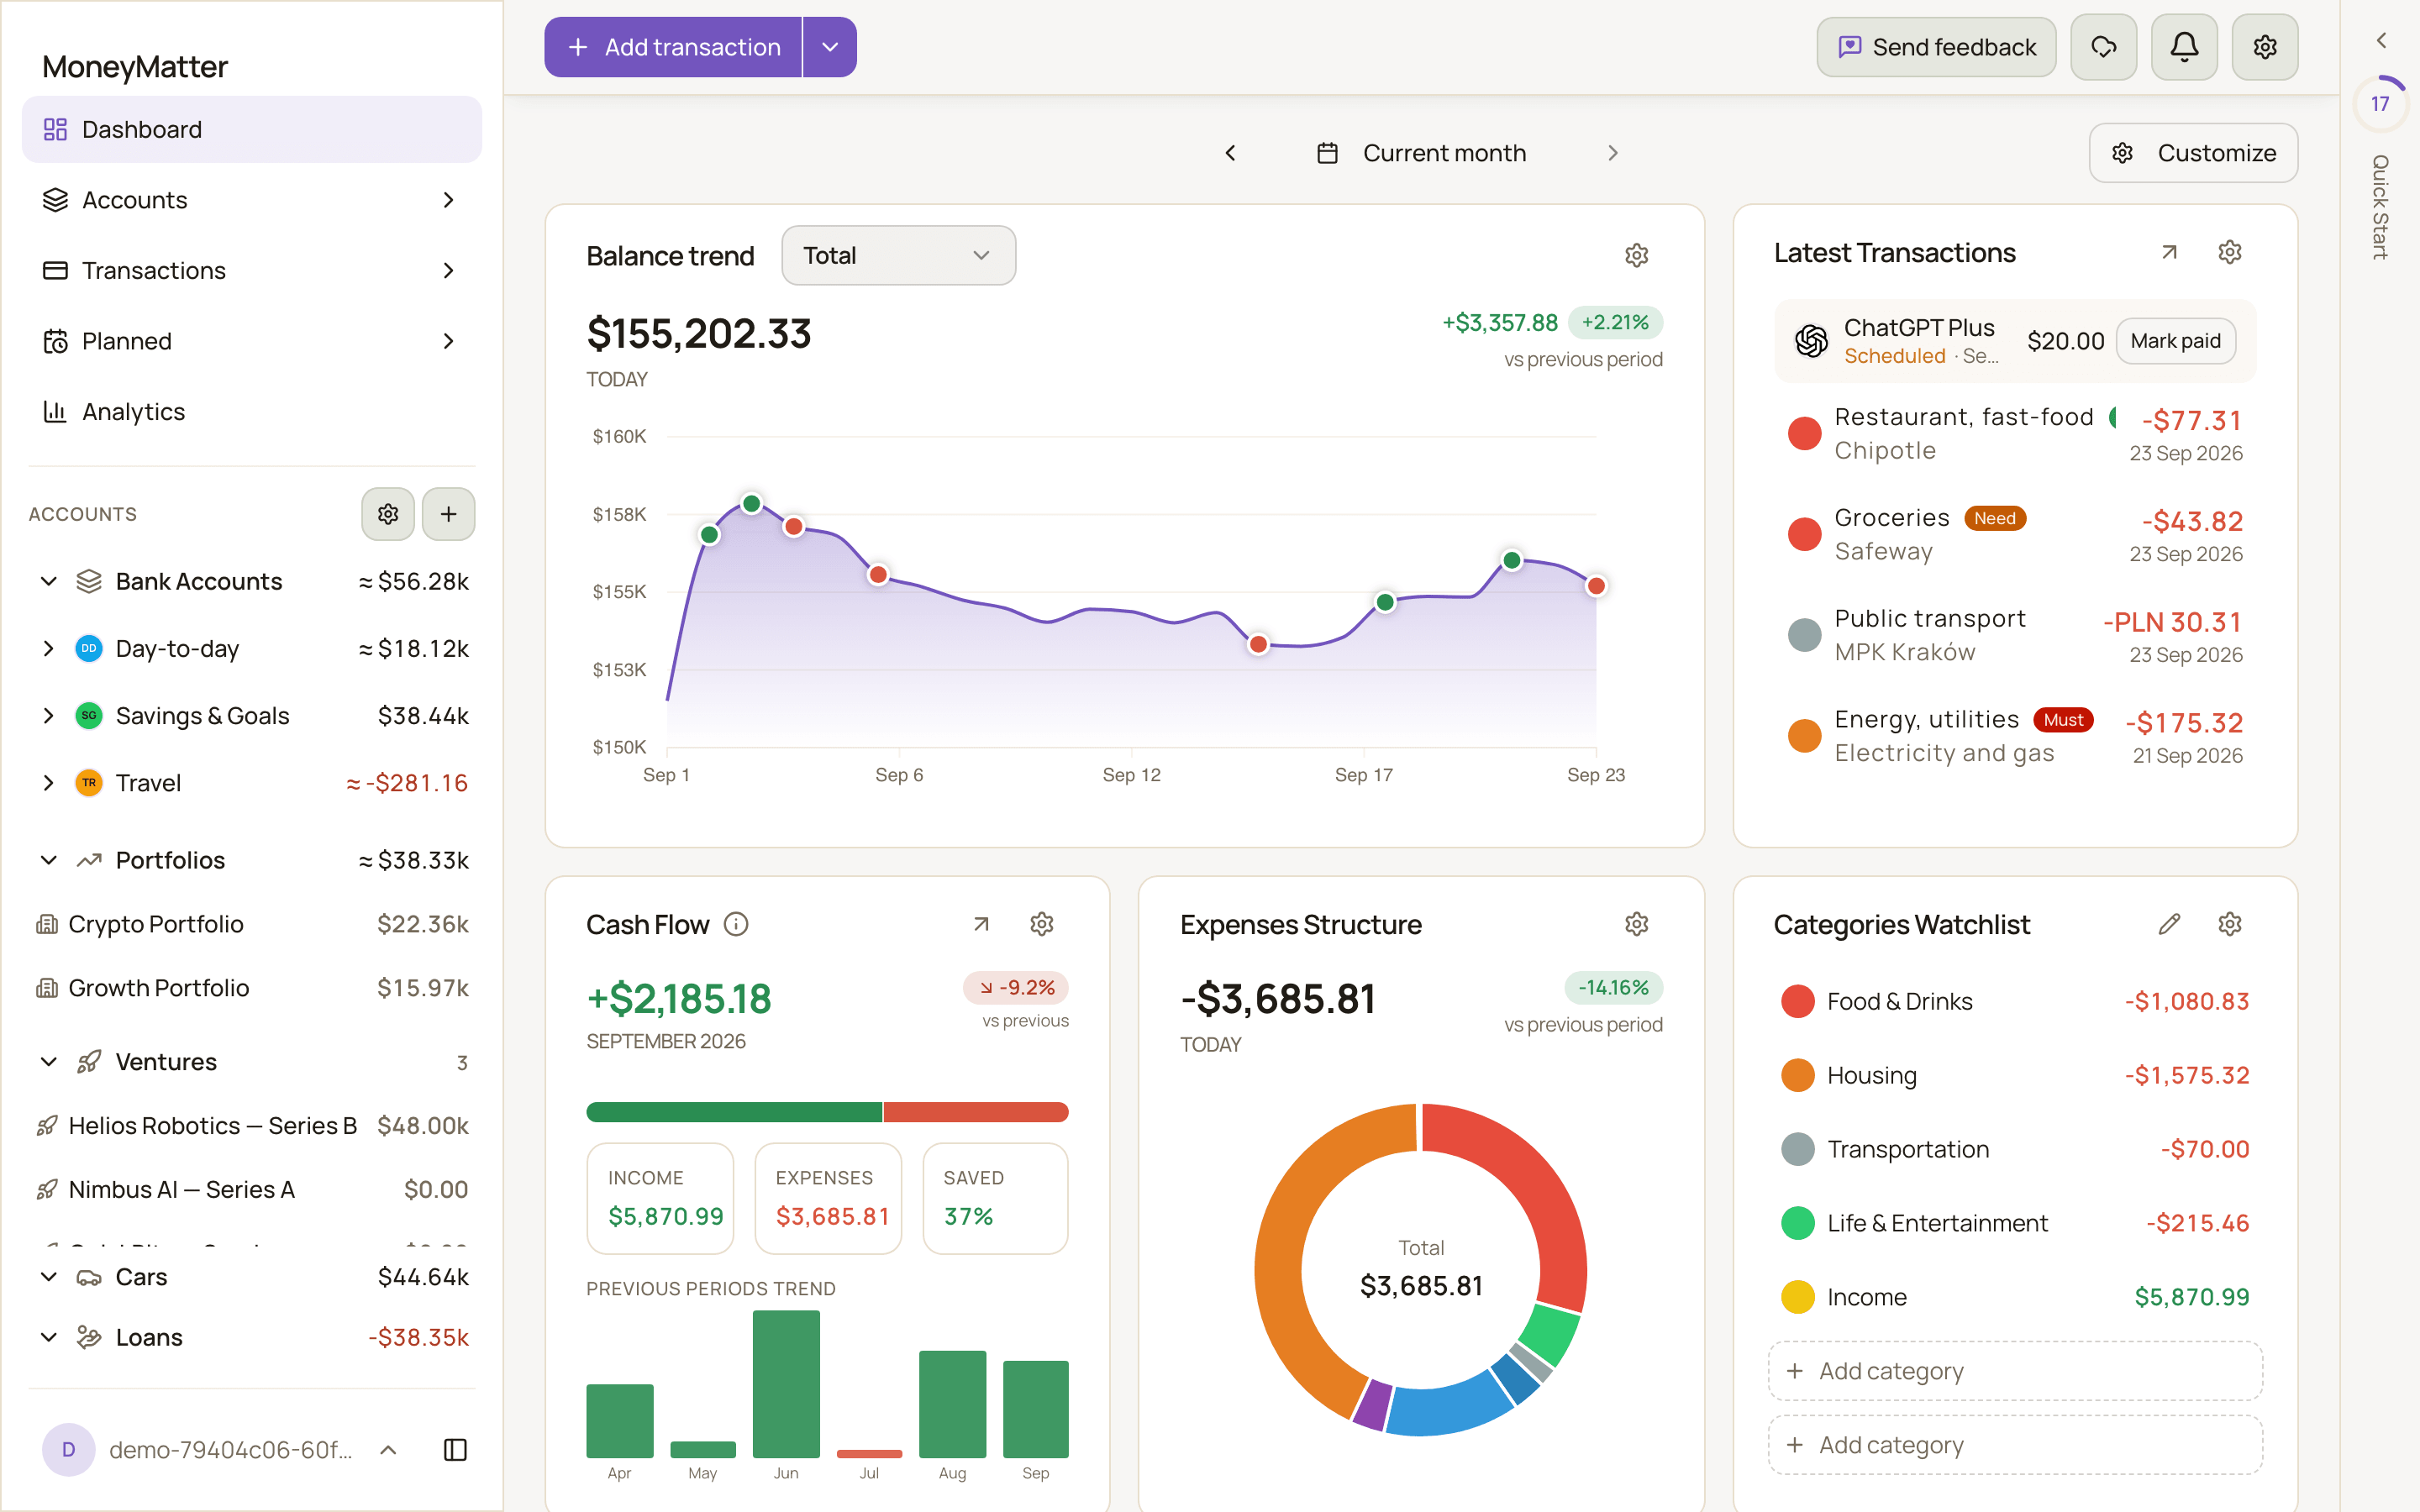
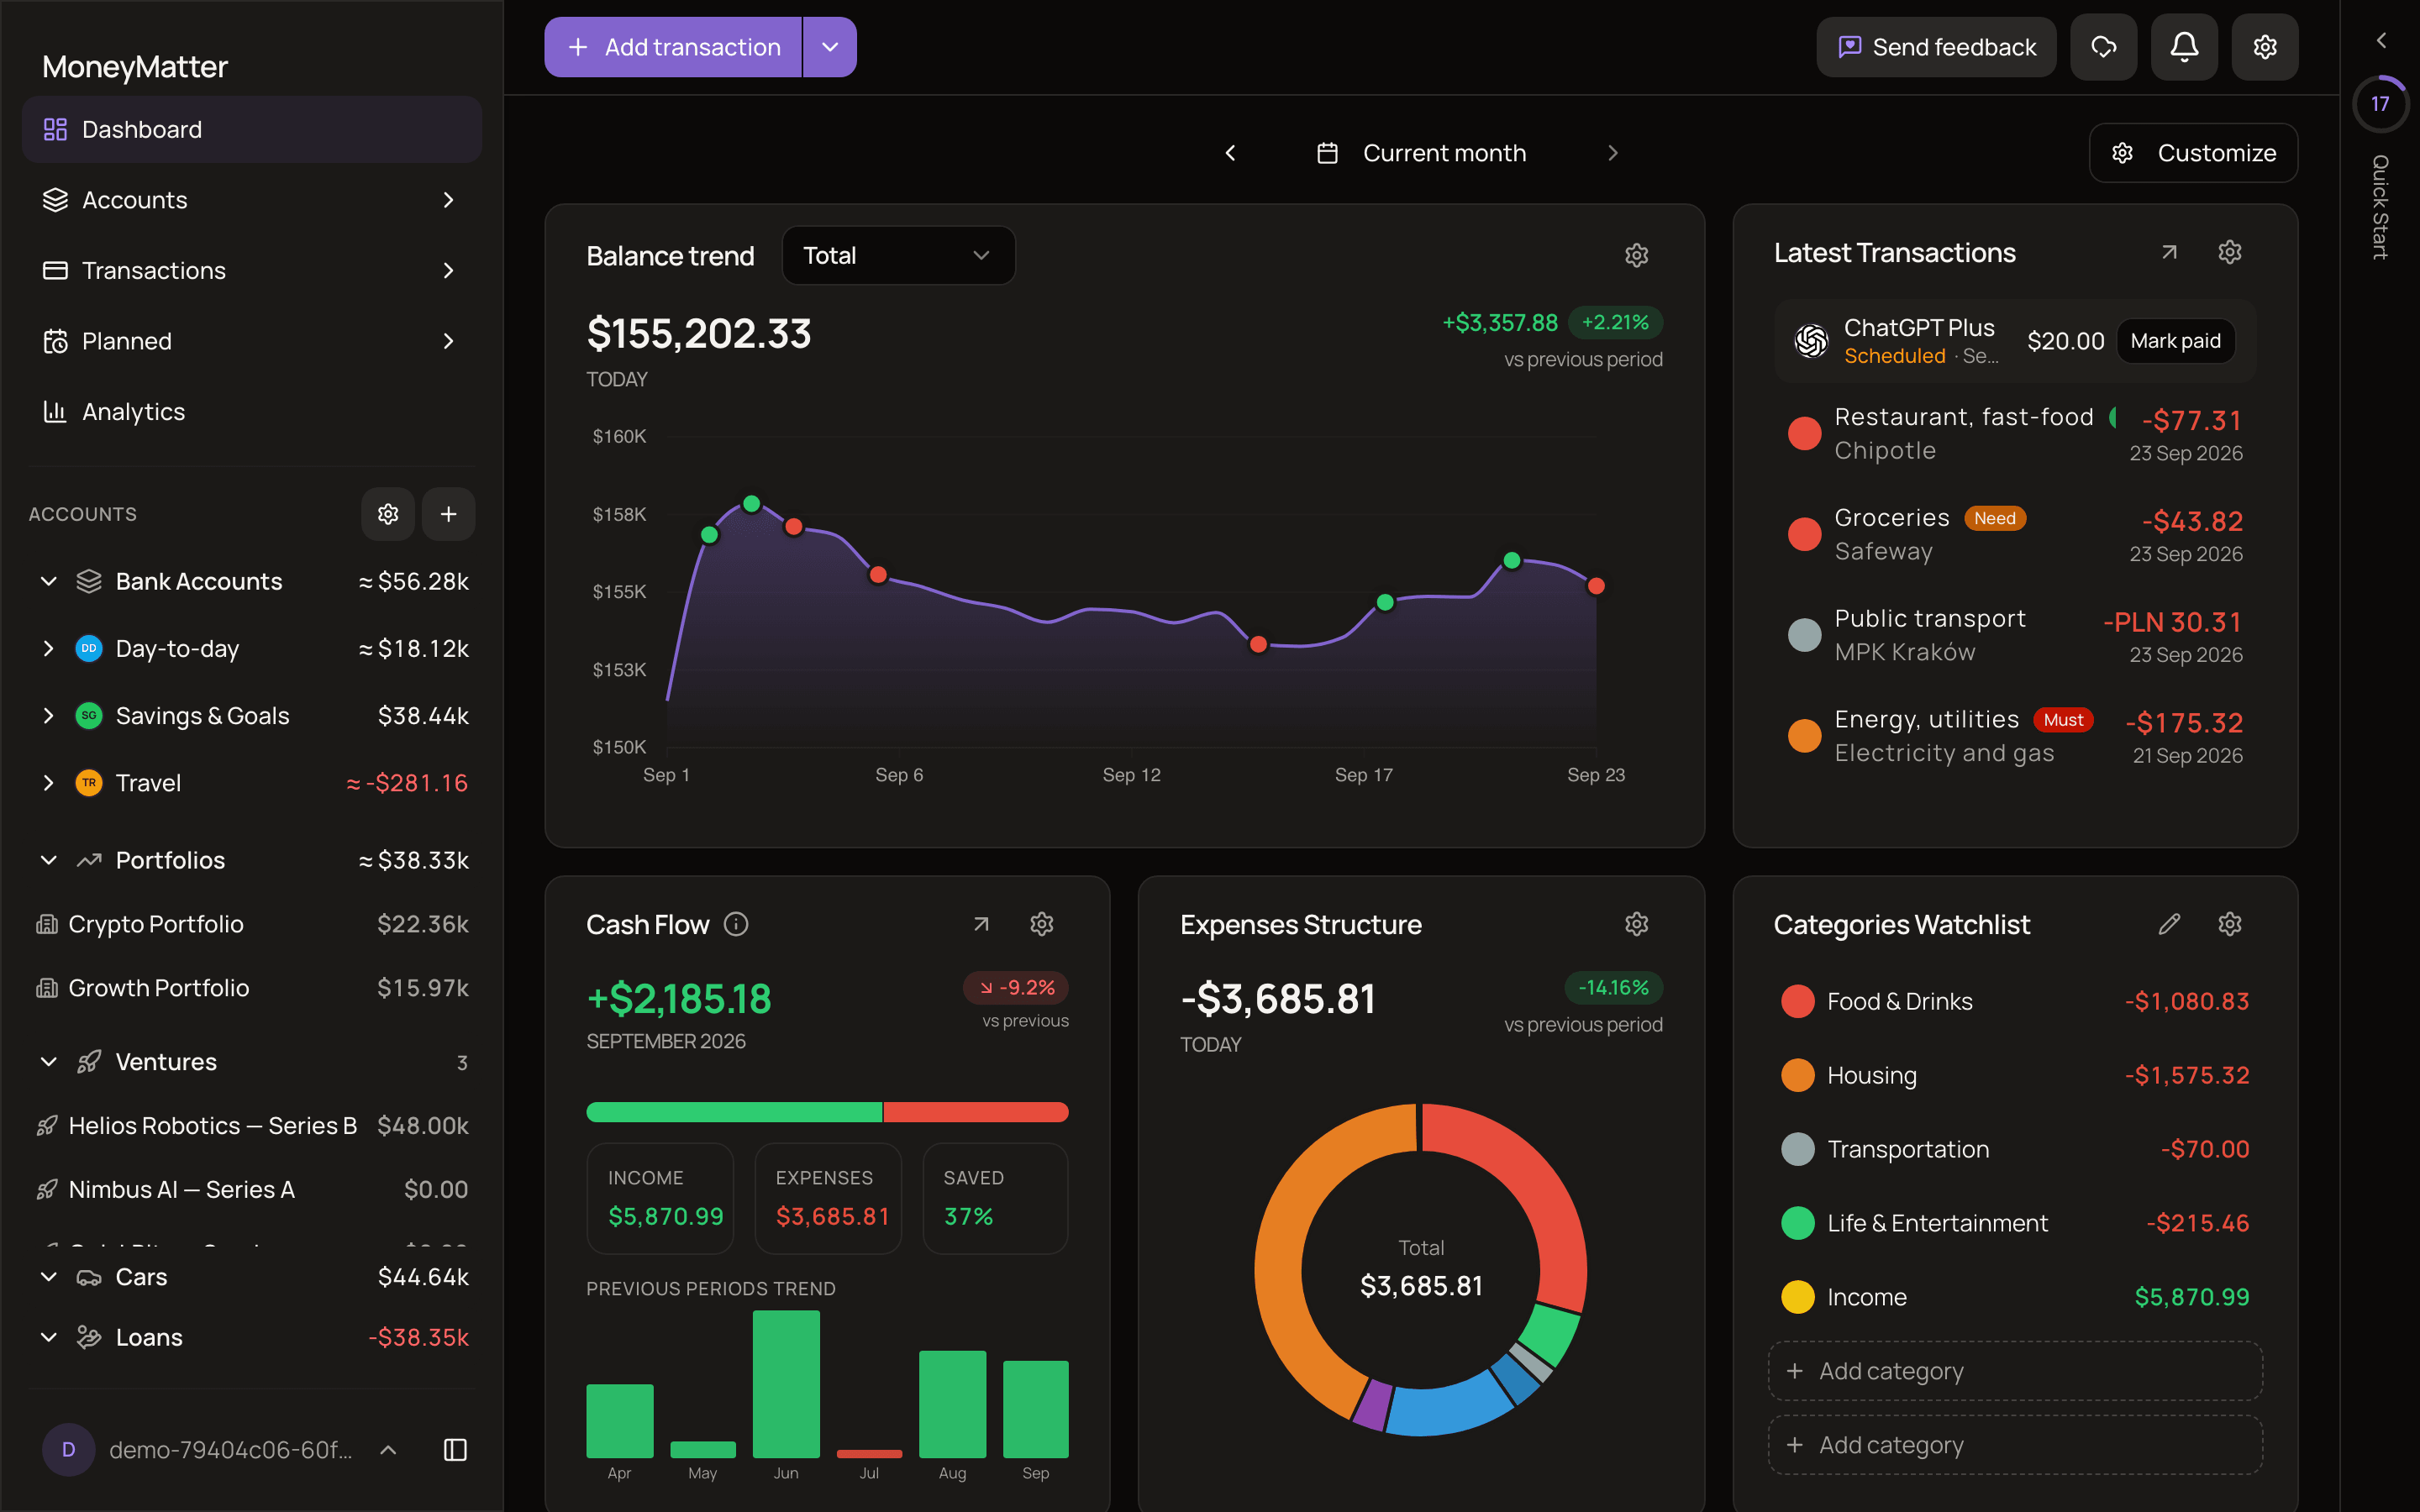
The dashboard is your overview: balances, spending and savings for the period you choose, laid out the way you like. Open it from Dashboard in the sidebar.
Until you add your first account, the dashboard shows setup steps instead of widgets.
Choose the period
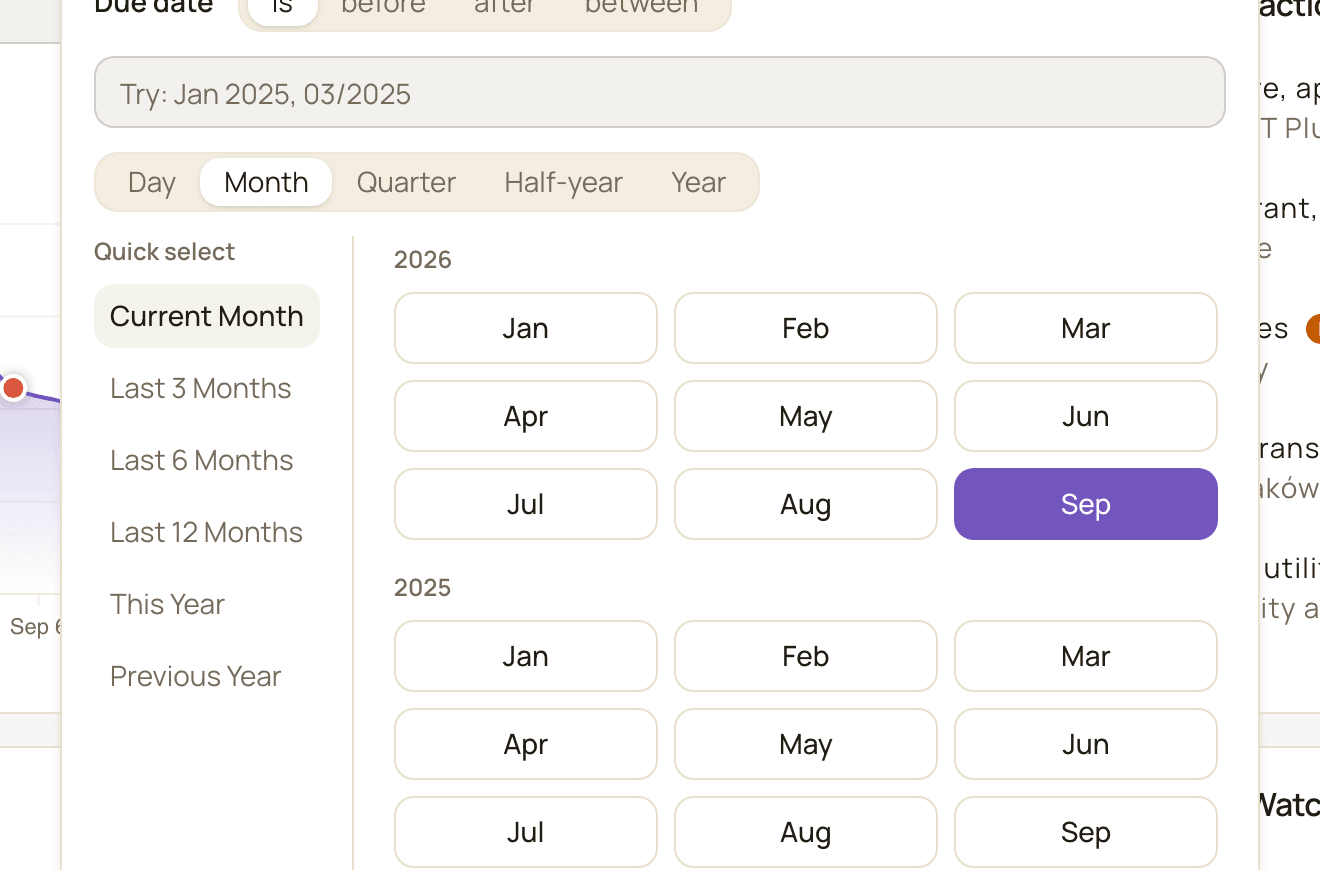
Section titled “Choose the period”The dashboard opens on the current month. Every widget that shows a period follows the date selector at the top of the dashboard (on a phone, it’s pinned to the bottom of the screen).
Use the arrows on either side of the date to move the whole range back or forward by its own length. For a single month that’s one month; for Last 3 Months it’s three months. A range that doesn’t cover whole months moves by the same number of days.
To pick a different range:
- Click the date.
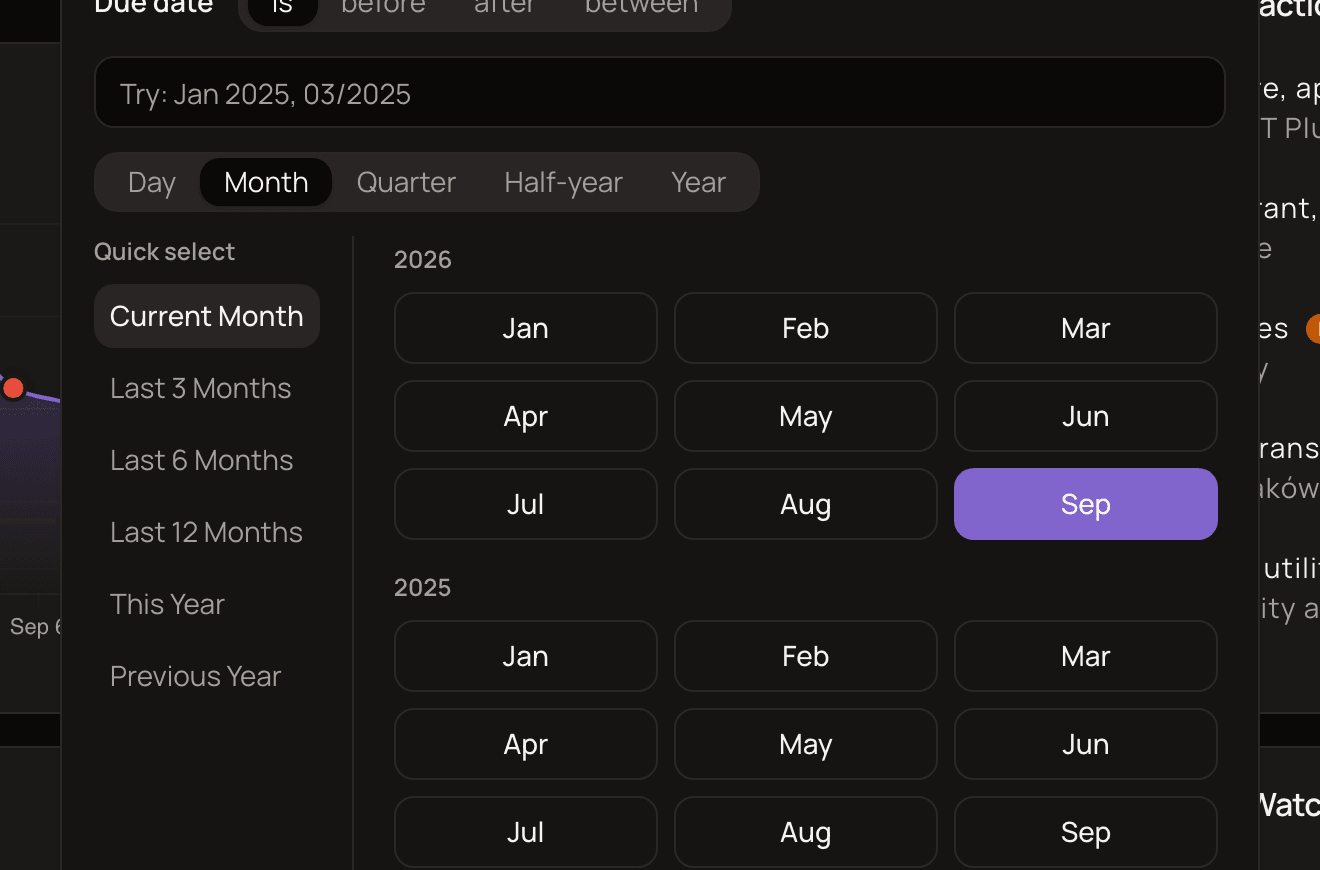
- Choose a preset (Current Month, Last 3 Months, Last 6 Months, Last 12 Months, This Year or Previous Year), which applies straight away. Or choose Day, Month, Quarter, Half-year or Year and select a range.
- For a custom range, click Apply.
Customize the layout
Section titled “Customize the layout”You choose which widgets appear, their size and their order.
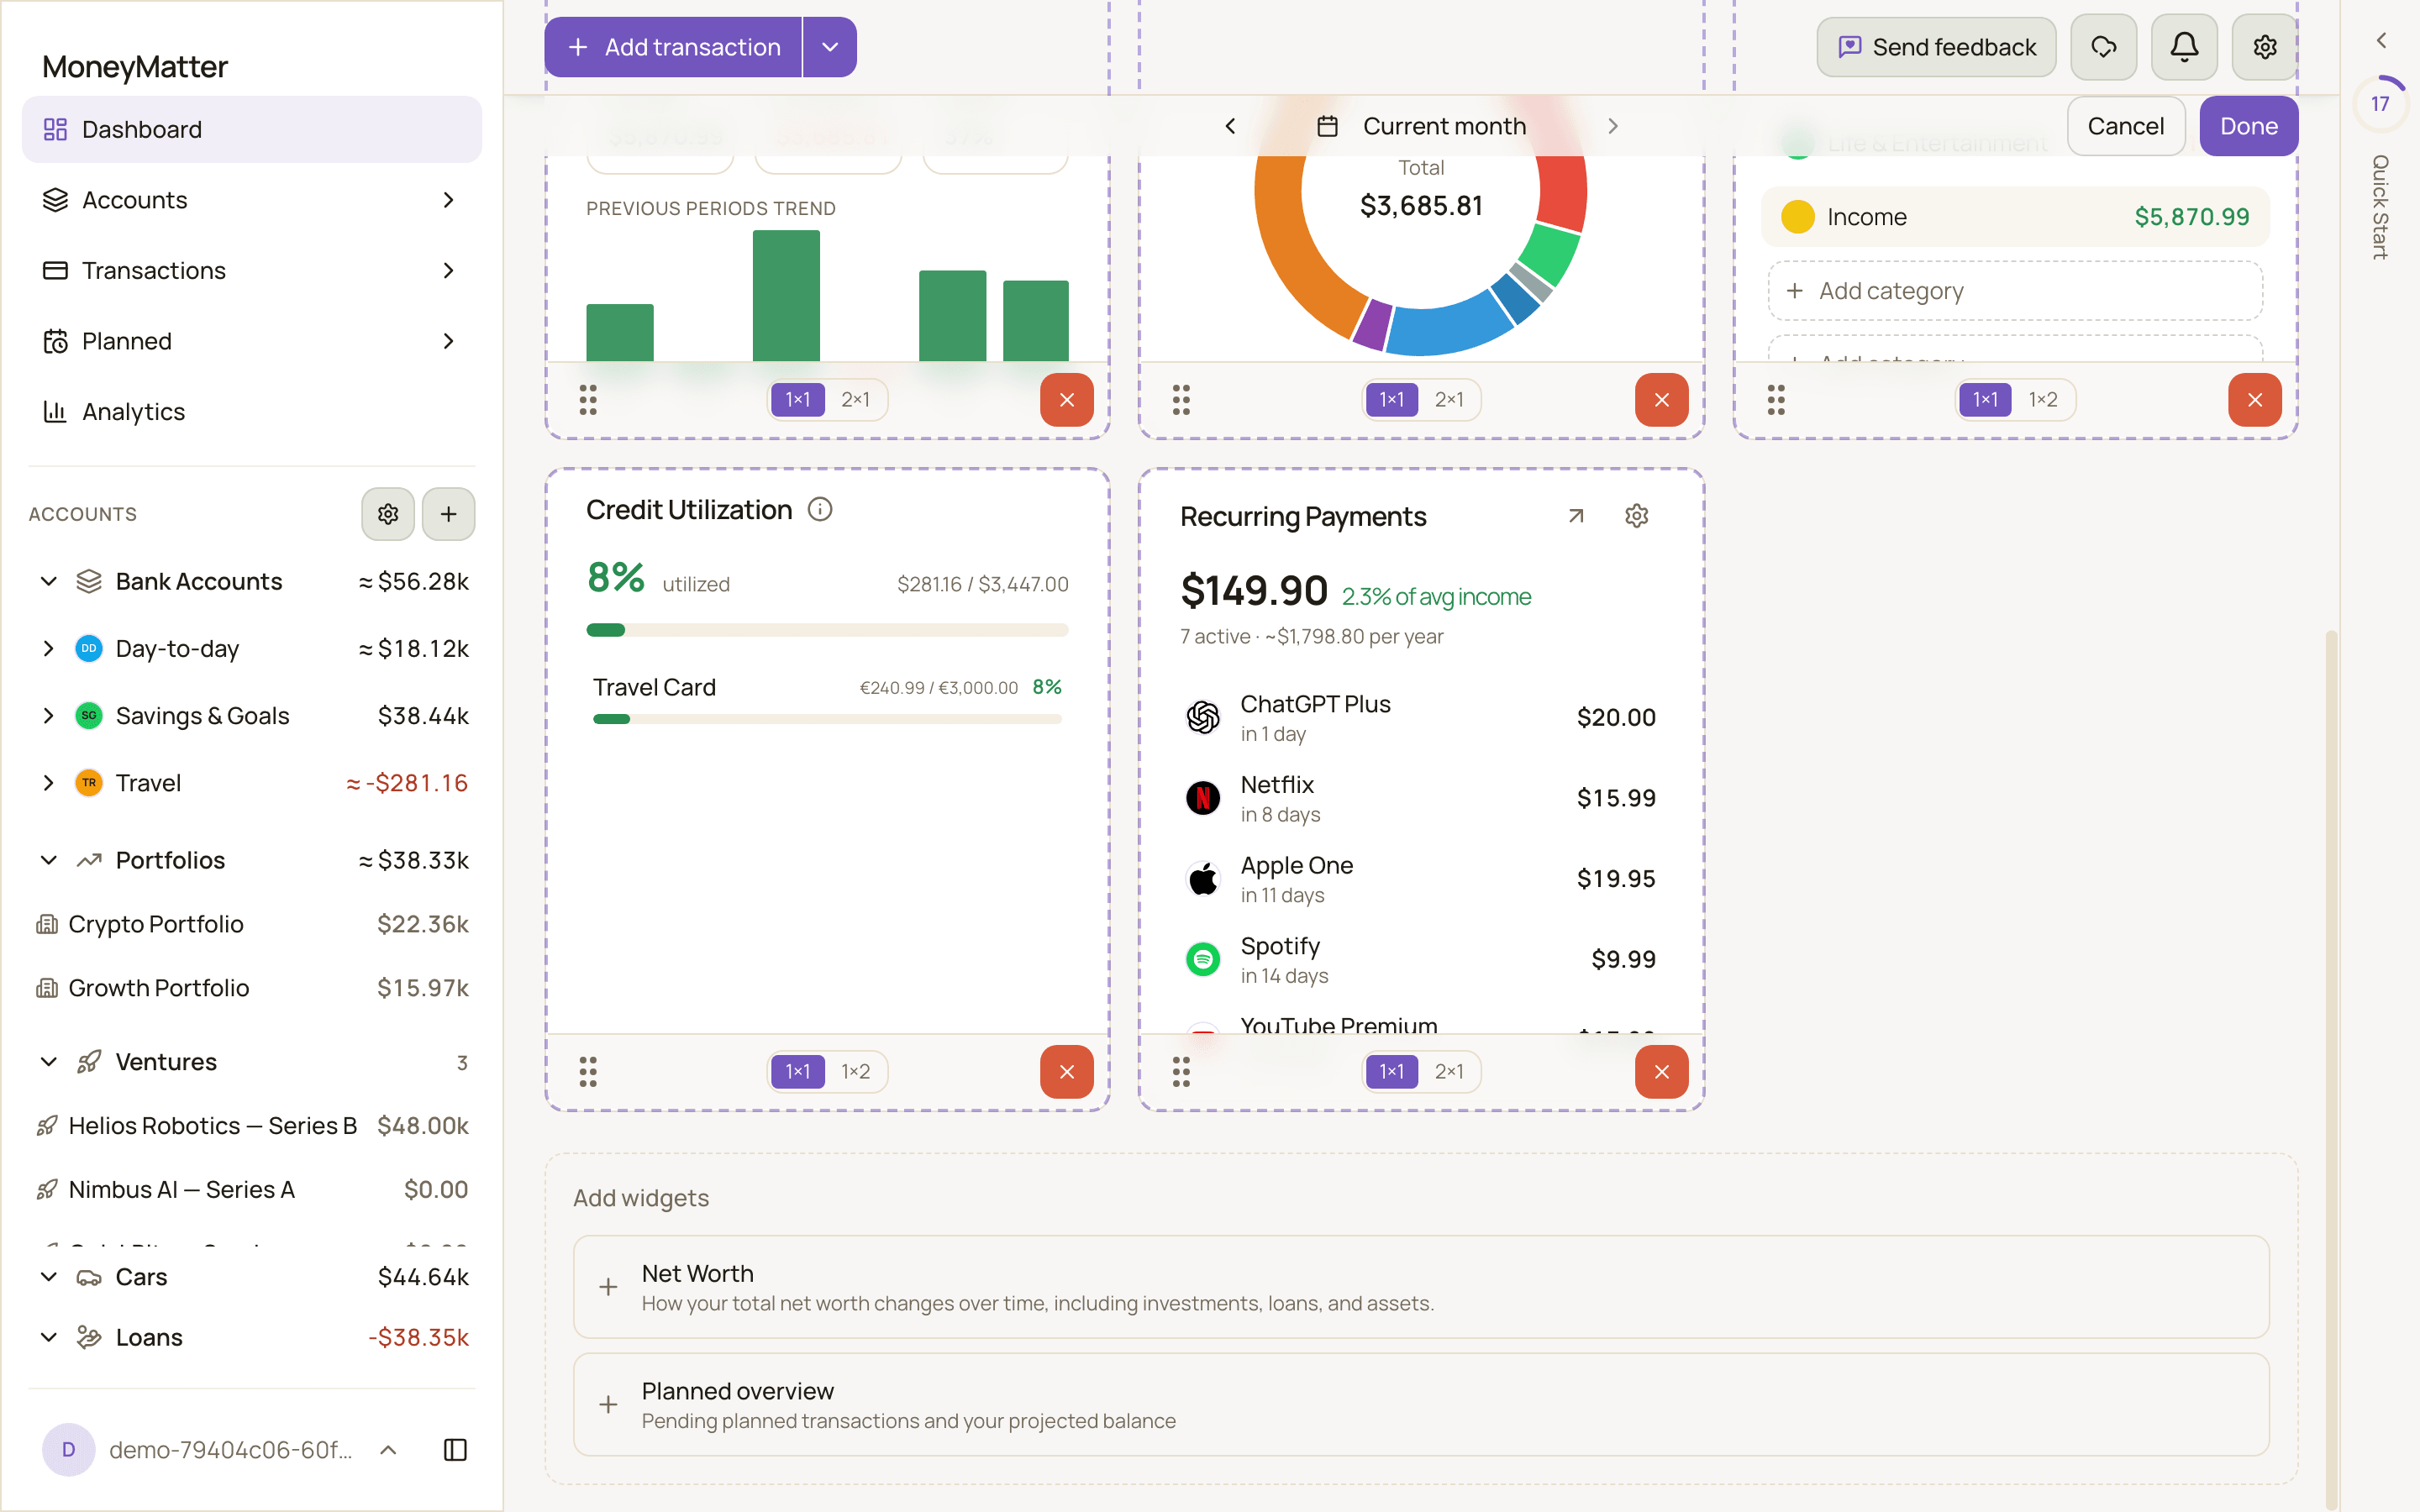
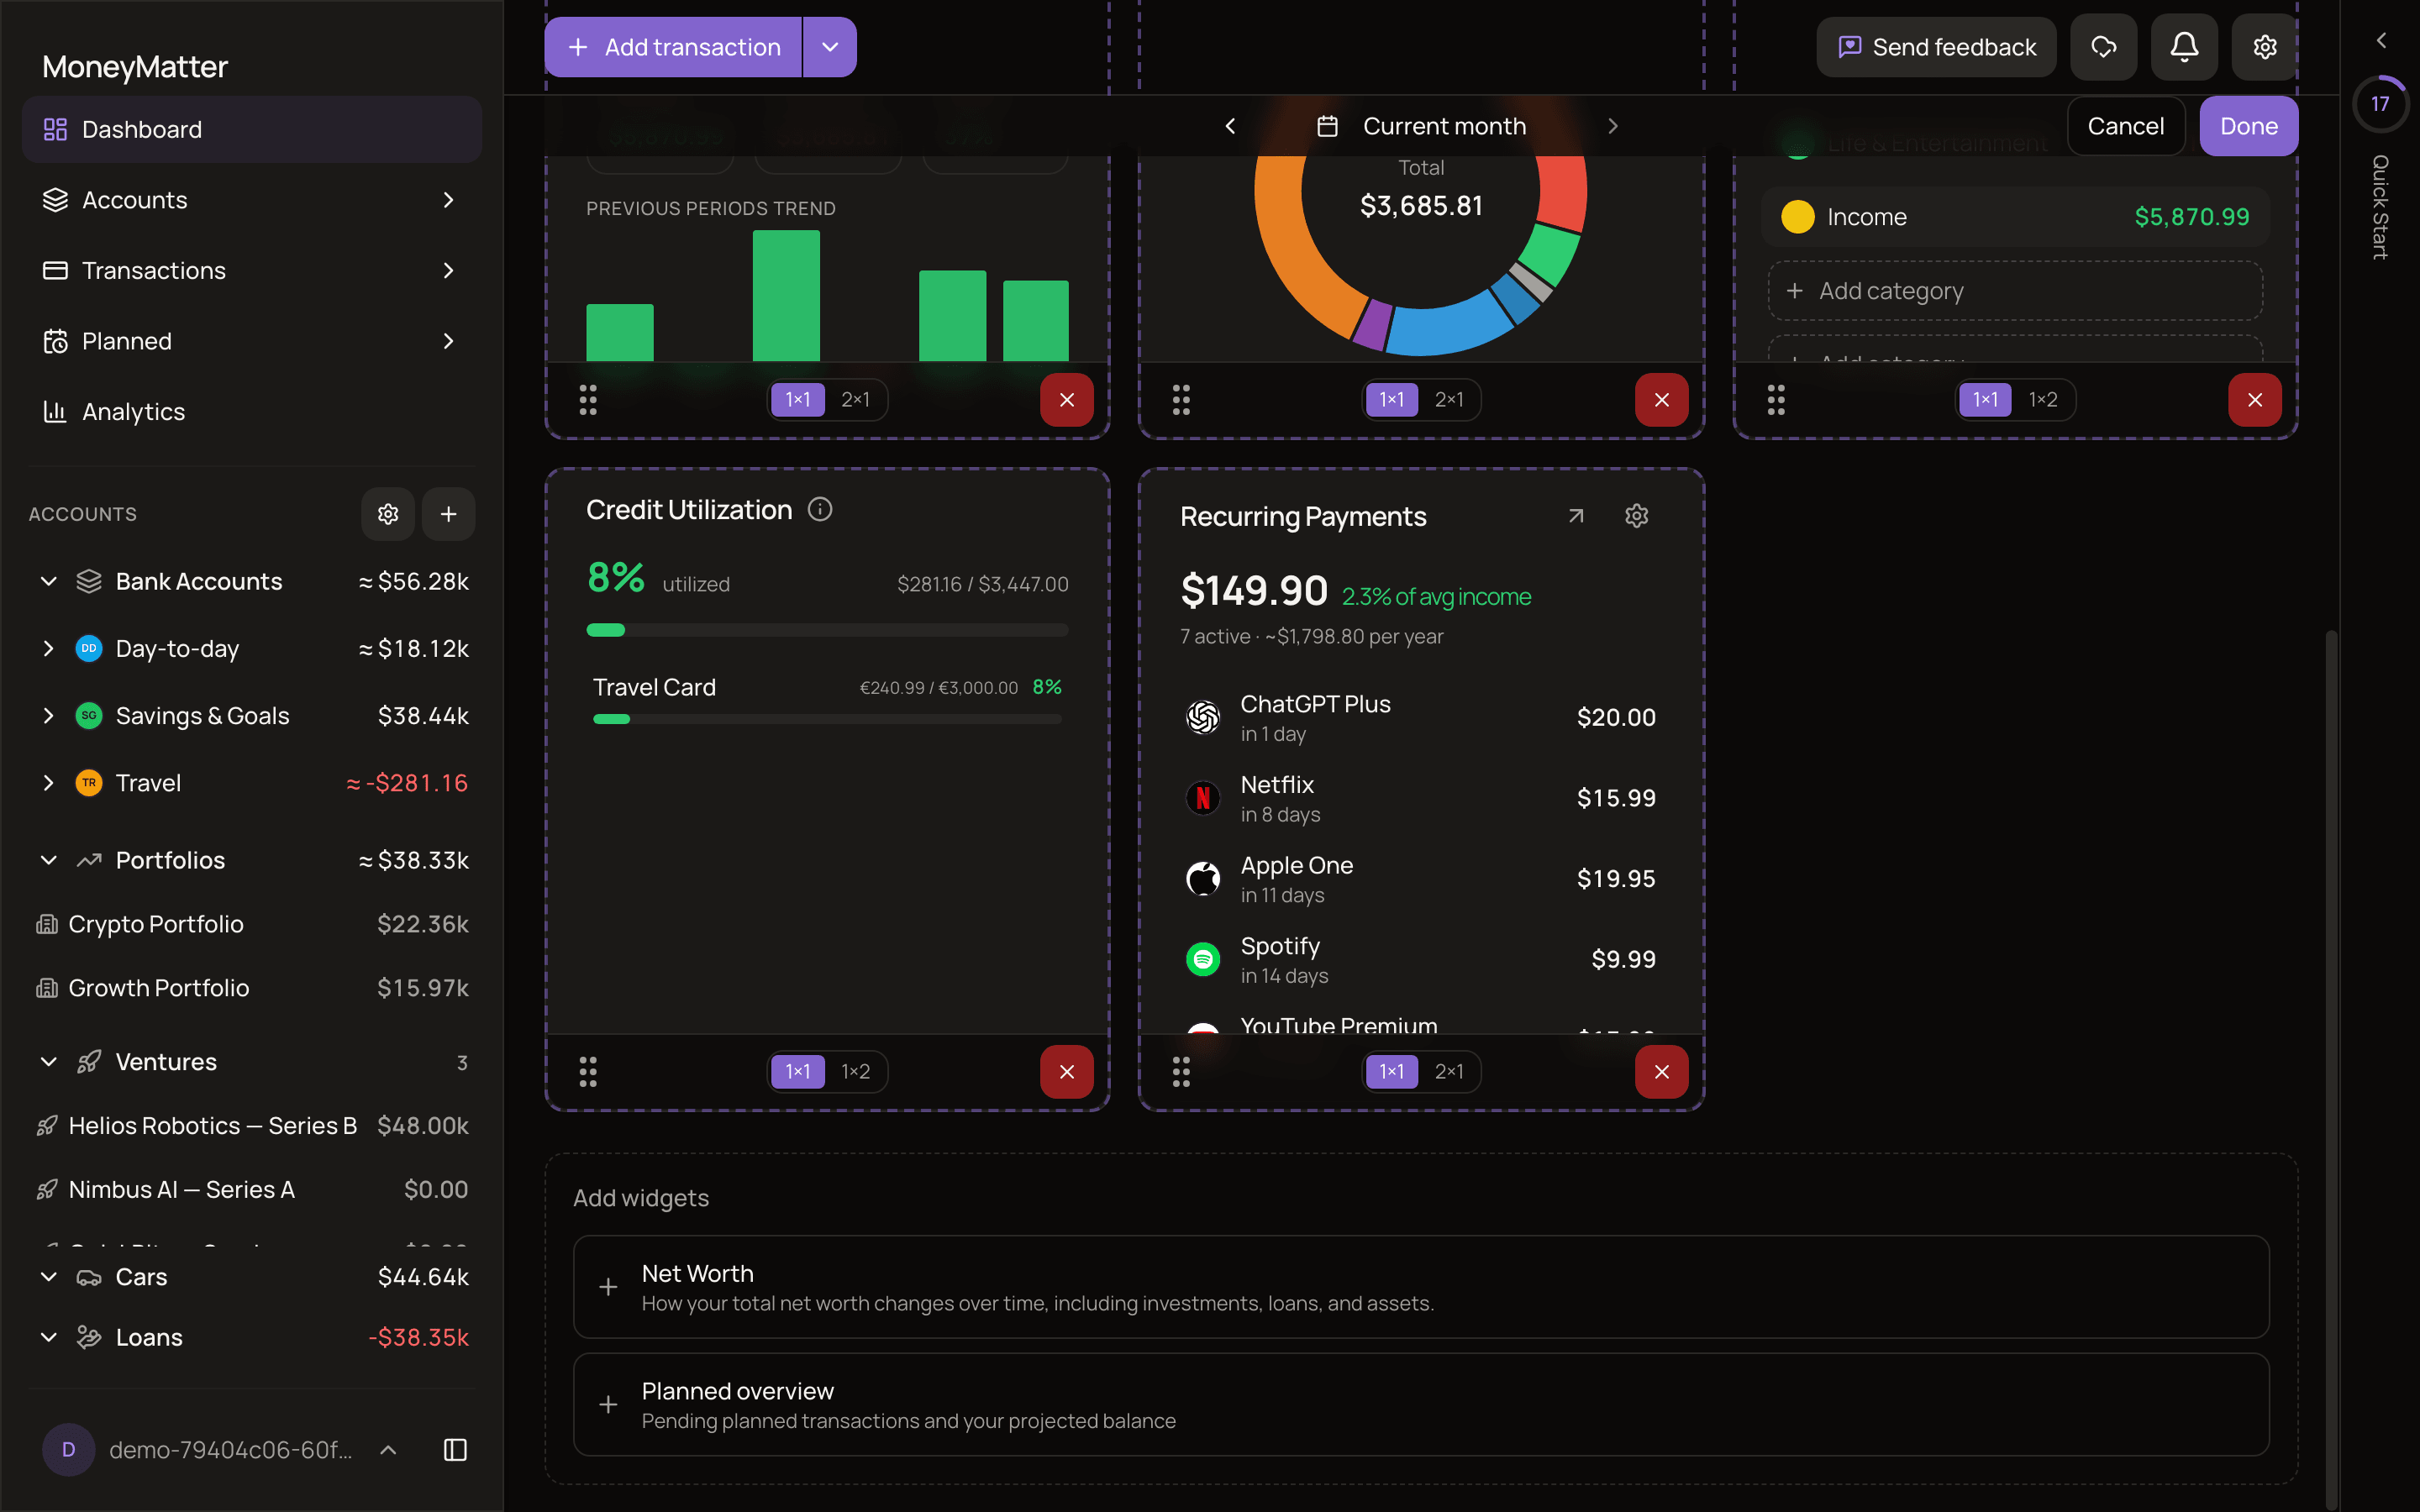
- Click Customize at the top of the dashboard. On a phone, the button is above the widgets.
- To reorder, drag a widget by the dotted grip icon (⋮⋮) that appears on it.
- To resize, click one of the size buttons on the widget, such as 1×1 or 2×1. Each widget offers the sizes that suit it.
- To remove a widget, click the red ✕ on it. You can’t remove the last widget.
- To add a widget, click it in the Add widgets panel. The panel lists only widgets that aren’t on your dashboard yet, since each widget can appear once.
- Click Done to save your layout, or Cancel to discard the changes.
The widgets
Section titled “The widgets”The Add widgets panel and the widget itself sometimes use different names. Here’s how they match up.
| In Add widgets | On the dashboard | What it shows |
|---|---|---|
| Balance Trend | Balance trend | Your total balance over the period |
| Spending by Categories | Expenses Structure | Your spending split by category |
| Cash Flow | Cash Flow | Income, expenses and how much you saved |
| Categories Watchlist | Categories Watchlist | Chosen categories and what came in or went out of each |
| Net Worth | Net Worth | How your net worth changed over the period |
| Credit Utilization | Credit Utilization | How much of your credit limits you’re using |
| Latest Records | Latest Transactions | Your most recent transactions |
Subscriptions & Bills and Planned overview are also available as widgets.
The numbers follow the rules in How stats are calculated. Transfers between your own accounts (except loan payments), Out of Wallet transfers and balance adjustments never count as income or expenses. Accounts with Exclude from statistics on are left out of every widget’s numbers. Their transactions still show in Latest Transactions.
Balance trend
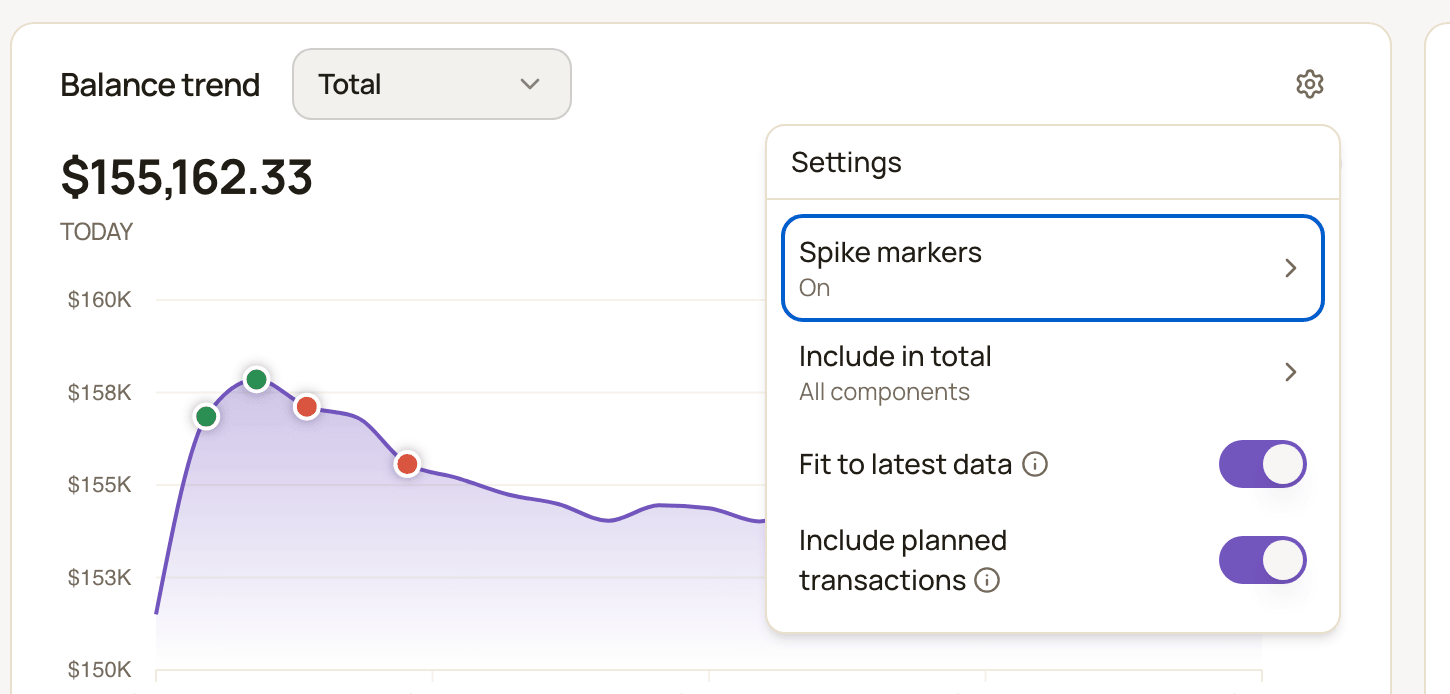
Section titled “Balance trend”A chart of your balance across the period. The big number is your latest balance in the period. It’s labelled Today when you’re viewing the current month. Next to it you’ll see the change vs previous period, compared with the same number of days just before.
Use the line selector on the widget to switch between Total, Accounts and Portfolios, plus Ventures, Vehicles and Loans when you have them. Real data stops at today.
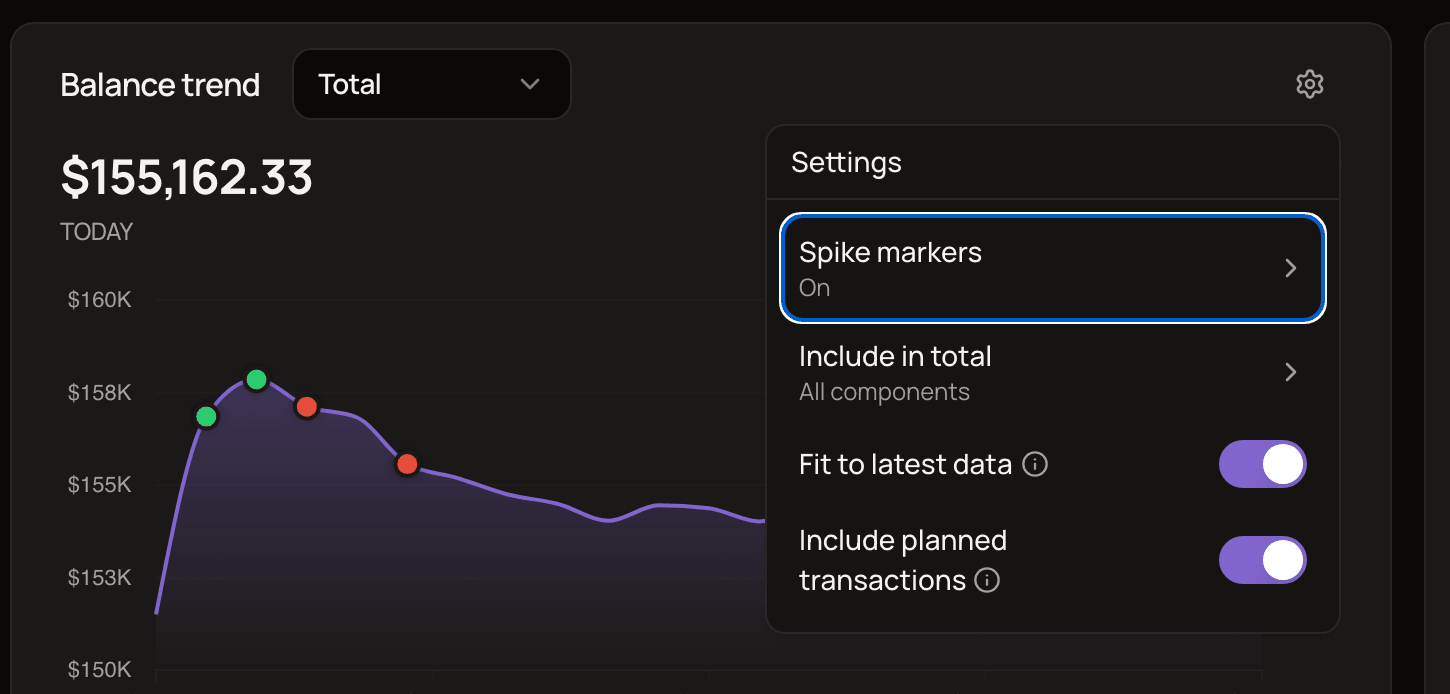
The gear icon opens Settings:
- Spike markers: highlight days when your balance changed a lot. Set Min change %, Min change $ and Max markers, or click Reset defaults, then Accept. Click a marker on the chart to see the transactions behind it, with a See all transactions link.
- Include in total: choose whether Vehicles, Ventures and Loans count toward the Total line. All three are on by default. With Loans on, what you owe on loans is subtracted from the total.
- Fit to latest data: when on, the chart stops at your latest data point. When off, it spans the whole period. While the planned-transactions projection is showing, this switch is disabled and the chart always runs to the end of the period. Turn off Include planned transactions to change it.
- Include planned transactions (on by default): when the period reaches today and the line is Total or Accounts, a dashed line continues past today to show where your upcoming planned transactions would take the balance.
Expenses Structure
Section titled “Expenses Structure”A donut chart of your spending by top-level category. Subcategories are grouped under their parent. The big number is your total spending for the period, with a percentage vs previous period.
Click a slice to open Transactions filtered to that category and its subcategories, for the same period.
Hide categories from the widget
Section titled “Hide categories from the widget”- Click the gear icon on the widget and choose Exclude categories.
- Pick the categories to hide. Hiding a parent also hides its subcategories.
- Click Save. Use Clear all to count every category again.
Hidden categories leave both the chart and the total. A badge next to the widget title shows how many are hidden.
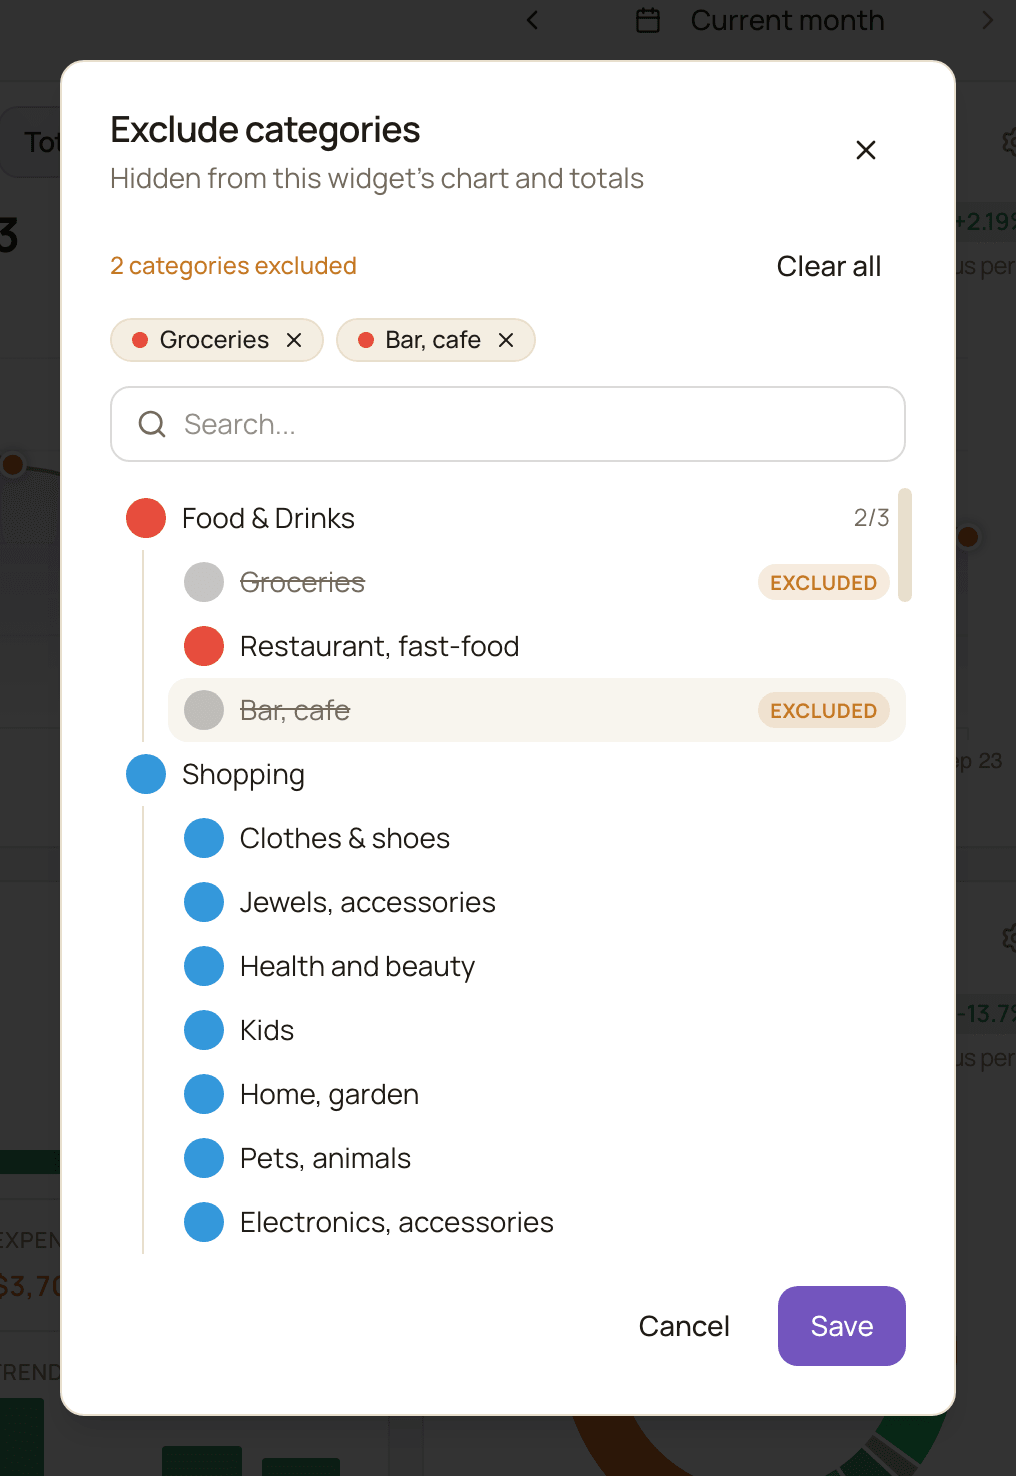
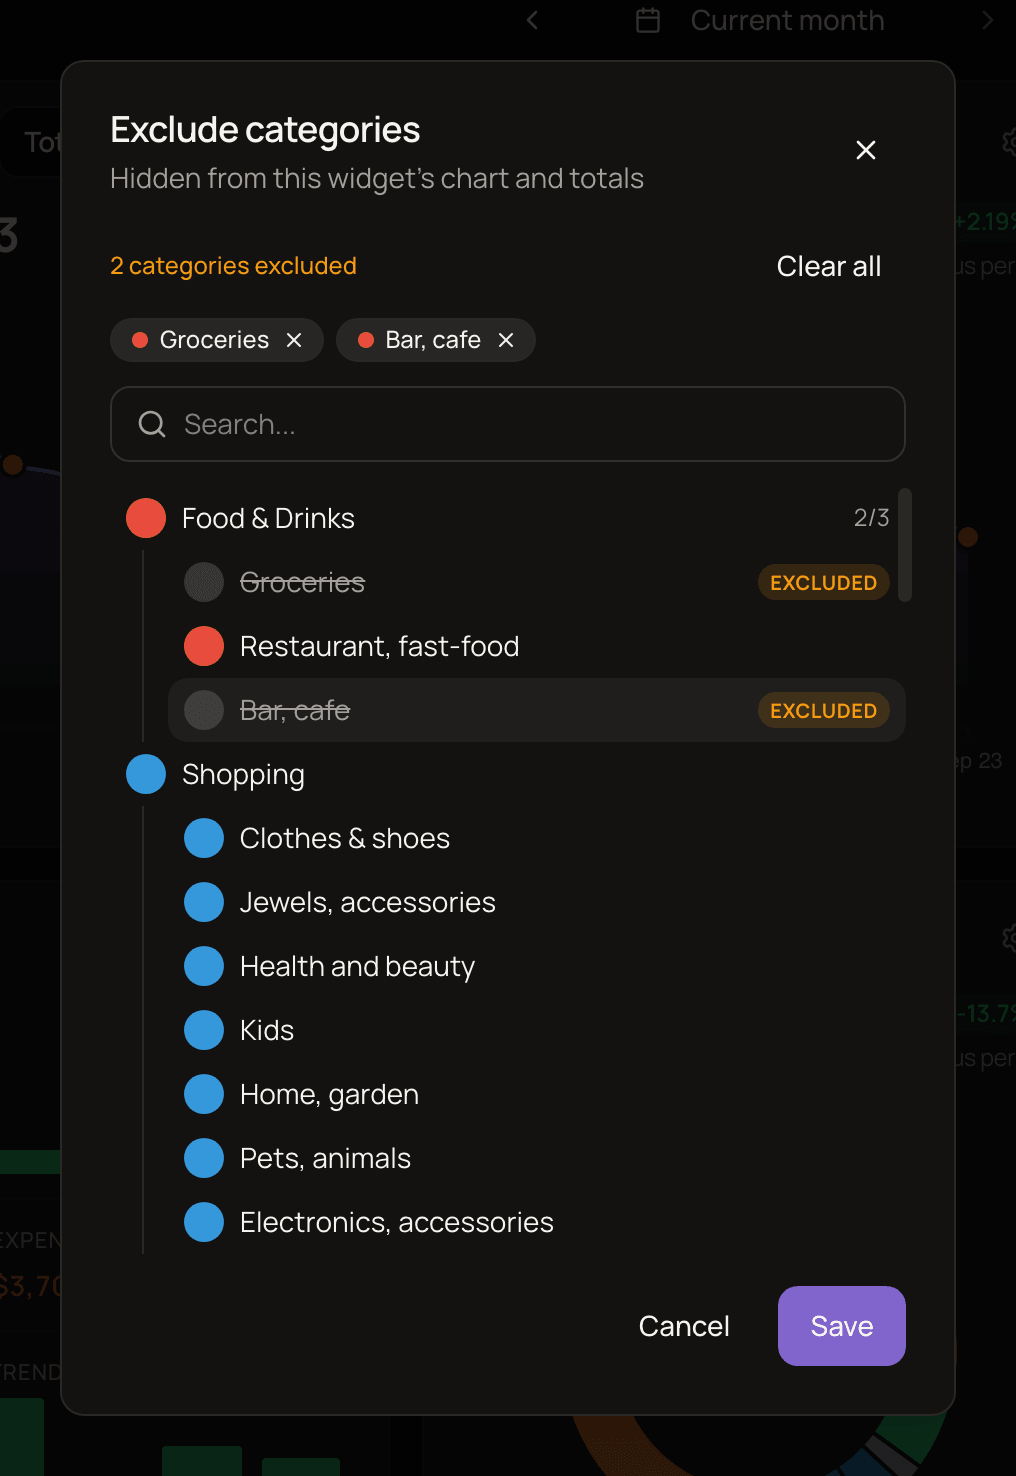
The same gear menu has an Include planned transactions switch.
Cash Flow
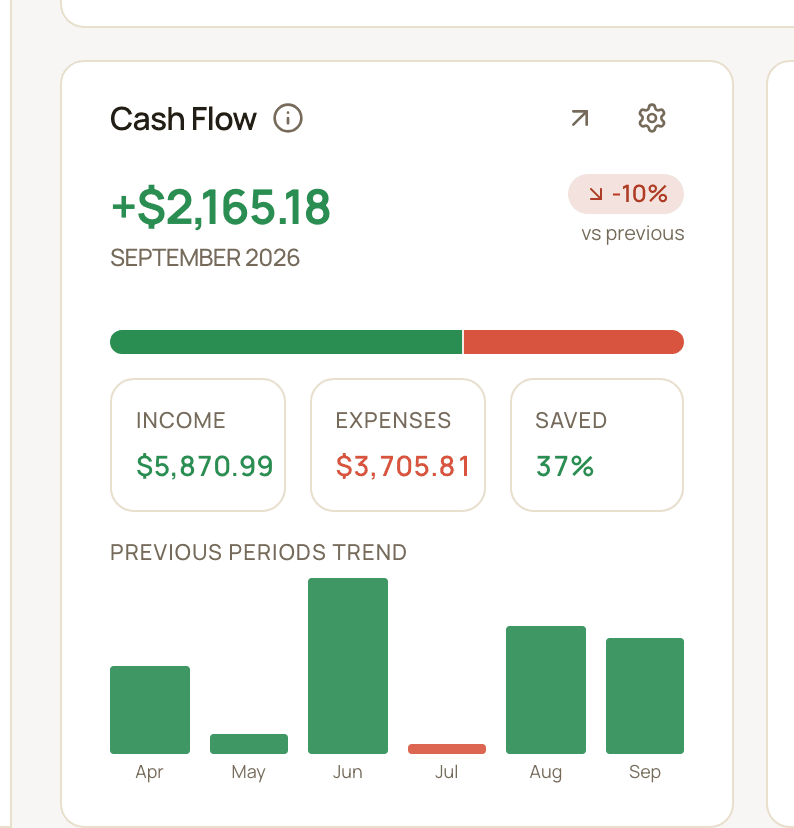
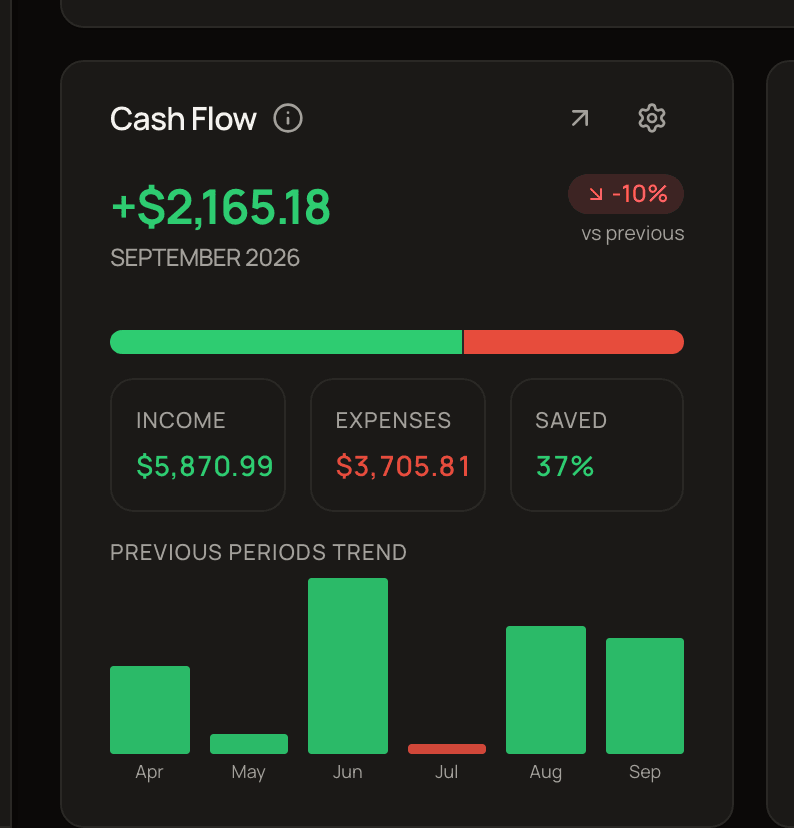
Section titled “Cash Flow”Shows how much you saved in the period: income minus expenses. Below the headline you’ll find a bar comparing the two, then Income, Expenses and Saved. Saved is your savings rate, the share of income you kept.
Previous periods trend shows the five periods before this one next to it. Click the arrow icon (↗) in the widget’s top corner (View details) to open the full Cash Flow report. The arrow is hidden while the widget has no data.
The gear menu has Exclude categories and Include planned transactions, which work the same way as in Expenses Structure.
Categories Watchlist
Section titled “Categories Watchlist”Keep an eye on the categories you care about. Each row shows what came in minus what went out for that category and its subcategories: green when it’s positive, red when it’s negative.
- Click an empty Add category row to pick categories in Select Categories. The widget holds up to 7 categories at size 1×1 and 16 at 1×2.
- Click the pencil icon to edit the list: drag rows to reorder, click a row to swap its category, or click the bin icon to remove it. Click the save icon when you’re done.
- Click a row to open its transactions for the period.
- The gear menu has Include planned transactions.
If you add both a parent category and one of its subcategories, the subcategory’s money shows only on its own row, not on the parent’s.
Net Worth
Section titled “Net Worth”Shows how your net worth changed over the period, including accounts, investments, loans and other assets.
The big number is how much your net worth changed over the period (End minus Start). Below it:
- Start: your net worth going into the period.
- End: your net worth at the end of the period.
- Growth: the change as a percentage.
You’ll also see the change vs previous and a Previous periods trend. Click the arrow icon (↗) in the widget’s top corner (View history) to open Net Worth History. The arrow is hidden while the widget has no data.
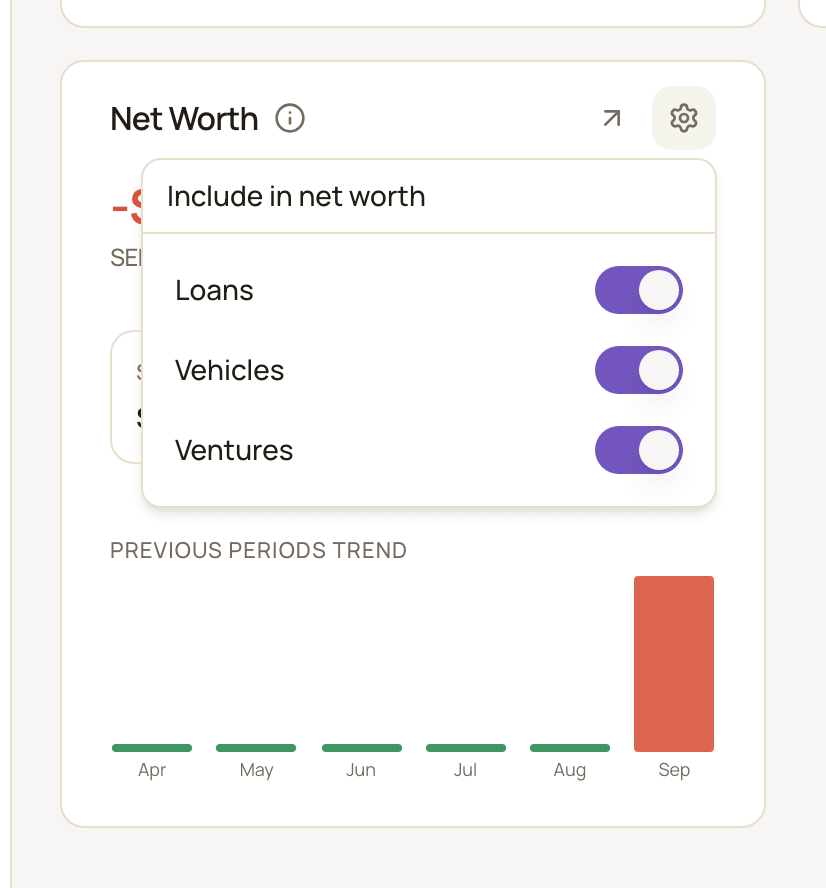
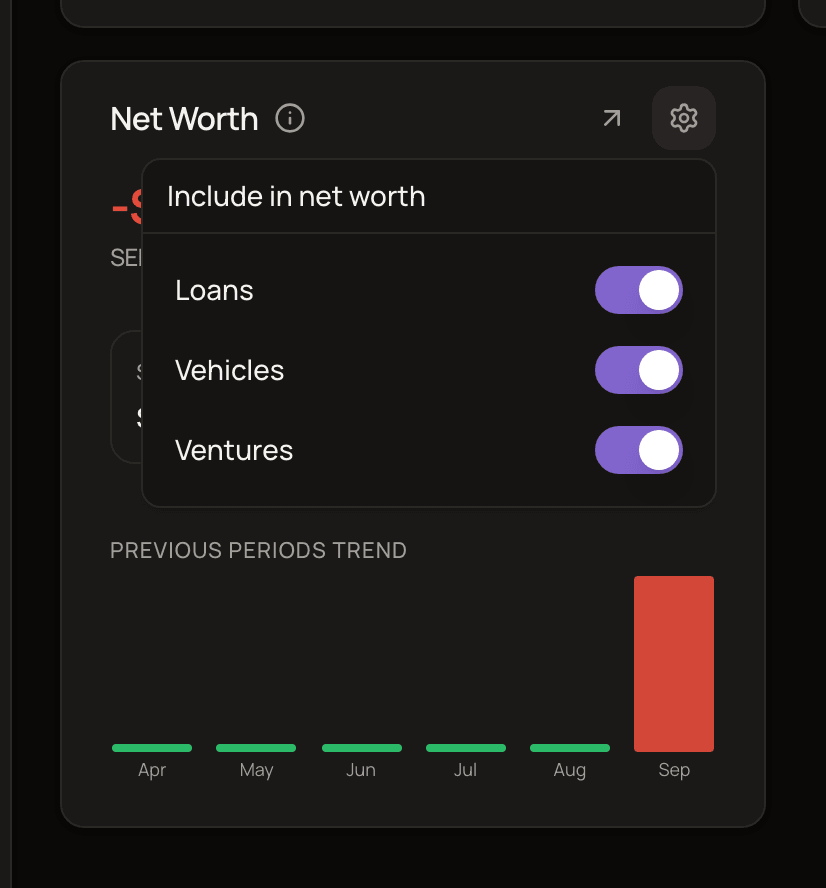
The gear menu opens Include in net worth, where you can leave out Loans, Vehicles or Ventures. When something is left out, a badge with a number appears next to the title. Hover it to see what’s excluded.
Credit Utilization
Section titled “Credit Utilization”Shows how much of your credit limits you’re using right now, per account and in total. It lists active accounts with a credit limit above zero that aren’t excluded from statistics. Usage below 40% shows green, 40–69% amber, and 70% or more red. Click an account to open it.
Latest Transactions
Section titled “Latest Transactions”Your most recent transactions. The arrow icon (↗) in the widget’s top corner (View all) opens the full list. In its settings, under Exclude transactions, you can hide Between accounts transfers, Out of wallet transfers, Balance adjustments and Planned transactions from the list.
Out of wallet transfers are hidden by default. Switch that exclusion off to see them.
Balance adjustments are recorded as Out of wallet transfers, so they’re hidden by default too. To see them, switch off the Out of wallet exclusion. Balance adjustments then lets you hide only the adjustments while keeping other Out of wallet transfers visible.
Comparing with the previous period
Section titled “Comparing with the previous period”Several widgets compare the period with the one before it, and they don’t all define “previous” the same way:
- Expenses Structure, Cash Flow and Net Worth: when you’ve selected a whole month, the previous calendar month. Otherwise, the same number of days just before.
- Balance trend: always the same number of days just before.